Project Summary
With offi ces across the world’s key petroleum
and natural gas extracting regions, VECO is a
leading provider of engineering, construction,
and maintenance services to the energy industry.
One of the company’s largest regional offi ces,
located in Anchorage, Alaska, employs over 1,000
people, including 250 engineering personnel who
use everything from 3D models to laser scanning
and beyond to boost productivity and deliver
better service to clients. Thanks to its advanced
features and interoperability, AutoCAD serves as
the technology hub for all the offi ce’s projects.
Utilizing Autodesk software, VECO is:
• Helping clients save as much as one-half million
dollars in engineering fees
• Effi ciently maintaining accurate documentation
• Creating sophisticated client presentations
quickly and easily
• Delivering value and innovative services to
clients
• Increasing productivity throughout the design
process
The Challenge
Accurate Designs Essential
VECO’s engineering team members use their
expertise to help clients maintain existing assets,
build new infrastructure, and keep infrastructure
documentation up-to-date. Whether they are
keeping Trans-Alaska Pipeline projects on schedule
or designing retrofi ts for offshore gas platforms,
the VECO team must guard against errors. When
they creep into designs, errors not only increase
costs during construction, but they also put critical
schedules in jeopardy.
“Most of our work is schedule-driven,” says
Mark Christenson, VECO’s design technologies
manager. “We depend on our design tools to
perform as expected. Our design software needs
to be able to help us reduce the risk of errors and
be interoperable with the technology we use to
maximize productivity.”
VECO
Customer Success Story
AutoCAD®
Autodesk® 3ds Max®
Autodesk® Raster Design
“AutoCAD serves as the hub of our design
processes. It is at the core of everything
we do from getting started to the fi nal
deliverable. All our engineering disciplines
use AutoCAD to design, create renderings,
and collaborate. Because AutoCAD is so
interoperable, we can do more.”
Mark Christenson,
Design Technologies Manager,
VECO
The Solution
VECO uses a wide array of software to win new
work and move projects forward. For presentations
with prospective clients, VECO creates photorealistic
models with Autodesk 3ds Max. When
retrofi tting existing infrastructure from paperbased
plans, VECO scans the images and converts
them to a digital format with Autodesk Raster
Design. And VECO turns to specialized third-party
applications for certain aspects of plant design.
In every case, AutoCAD is at the center of these
processes.
“AutoCAD serves as the hub of our design
processes,” reports Christenson. “It is at the core
of everything we do from getting started to the
fi nal deliverable. All our engineering disciplines
use AutoCAD to design, create renderings, and
collaborate. Because AutoCAD is so interoperable,
we can do more. It makes using innovative
approaches more practical and error-free.”
Faster As-builts
Helping to maintain the 800-mile-long Trans-
Alaska Pipeline, which runs from Prudhoe Bay to
Valdez, Alaska, is one of VECO’s most signifi cant
ongoing projects. The Alyeska Pipeline Service
Company, the pipeline’s operator, has strict
drafting standards, and until recently, most of the
pipeline documentation resided exclusively on
paper. To meet these challenges, VECO developed
a process that allows its design team to work with
plans in a digital format using Autodesk Raster
Design and AutoCAD.
According to Christenson, “We begin by converting
the plans from raster to vector data using
Autodesk Raster Design. Then we update the
designs in AutoCAD. We created custom standards
and menus in AutoCAD that further accelerate
the process. In the course of doing routine
maintenance, we have converted over 15,000
pipeline drawings to AutoCAD. The client now has
accurate, usable as-builts that they can use into
the future. It has been a very successful program
for us.”
More Time for Engineering
Another recent VECO project that depended
on the interoperability of AutoCAD for success
involved an offshore natural gas platform project.
A fi ltering problem was negatively impacting
the platform’s productivity. The operator
lacked accurate as-builts for the aging platform
and wanted to avoid the expense of extensive
redrawing. VECO turned to sophisticated laser
scanning technology to generate accurate plans.
The VECO design team then imported the data
into AutoCAD to design a solution to the problem.
“Being able to use laser scanning in conjunction
with AutoCAD on the project saved us a signifi cant
amount of time,” says Christenson. “Ordinarily,
redrawing and additional fi eld trips could have
taken up a considerable amount of the project
schedule. We signifi cantly reduced time spent
on redrawing and travel, which allowed us to
devote more of our energy to solving the client’s
problem.”
The Result
Saving Time and Reducing Costs
The interoperability of AutoCAD not only has
allowed VECO to use innovative processes and
technologies, but also has led to measurable time
and cost savings. “For us, AutoCAD is as essential
and dependable as email,” explains Christenson.
“We use it virtually every day. AutoCAD has helped
us to reduce the process of maintaining as-builts
for the Alaska Pipeline from hours to minutes. And
because it allowed us to use laser scanning more
seamlessly on the gas platform project, we were
able to save the client $500,000.”
For More Information
To learn more, visit:
www.autodesk.com/autocad
Try AutoCAD at:
www.autodesk.com/autocad-trial
Provide feedback and input on the future of
AutoCAD:
http://myfeedback.autodesk.com.
“AutoCAD has helped us to reduce the
process of maintaining as-builts for the Alaska
Pipeline from hours to minutes. And because
it allowed us to use laser scanning more
seamlessly on the gas platform project, we
were able to save the client $500,000.”
Mark Christenson,
Design Technologies Manager,
VECO
VECO
Tuesday, October 26, 2010
Monday, October 25, 2010
Making Vital Operational Information
Making Vital Operational Information
Available to Plant Managers
Located in Kenai, Alaska, Agrium KNO
processes natural gas to produce nutrient-rich
fertilizers such as ammonia and urea. The plant’s
processing facilities rely upon an extensive
network of piping that transports the gases
and product from one end of the facility to
another, with up to half a mile between stops.
Accordingly, plant personnel depend on detailed
piping and instrumentation diagrams that allow
them to stay informed.
“We have piping and instrumentation diagrams
that follow all of our piping from different
equipment locations in the plant,” explained
Mike Dunn, the CAD Administrator for Agrium’s
Kenai Nitrogen Operations. “It is imperative that
our plant operators have access to this data for
routine operations, or to troubleshoot problems
in the unlikely event of some type of process upset,
or in planning changes to the current system.”
No other format could properly render the
rich, detailed imagery of the piping and
instrumentation diagrams. “Our diagrams have
a lot of information packed onto them,” said
Dunn. “And they can be anywhere from 33 units
high to 150 units long. If you try zooming in on
a PDF image of that size, the image degrades
and it becomes a blur. You can’t even see it.
We needed a digital format that allows people
to zoom in on the piping and instrumentation
diagrams as much as necessary.”
DWF’s precise, accurate, design format
The solution to Agrium KNO’s challenges lay
with Autodesk DWF. DWF is a format
that was specifically developed to handle
engineering design data. The result is a high
degree of accuracy, fidelity, and data richness,
even when viewing the most detailed of diagrams
Agrium’s Kenai Nitrogen Operations have
converted more than 700 of their piping and
instrumentation diagrams into DWFs. These
important files are readily accessible on the
company’s intranet, where DWF Viewer is
conveniently embedded into Internet Explorer.
As a result, more than 230 Agrium employees—
ranging from plant operators, electricians,
engineers, machinists, and other maintenance
personnel—have instant access to vital
operational information.
The Result
Increasing Operational Efficiency
Agrium KNO’s use of DWF has been an unqualified
success, providing employees with a level
of information access that would not have
been possible with either conventional
paper-based models of distribution or through
competing products.
“DWF is very effective at providing our employees
with the detailed data they require,” stated
Dunn.“DWFs are a cost-effective way to provide
plant personnel with the most current drawing
revisions without any additional printing costs.
Thanks to DWF, they have that information
right at their fingertips versus having to track
down a hard copy print-out. That makes us more
effective at troubleshooting any operational
problems that may arise.”
Additionally, Agrium KNO has been impressed
with DWF’s ability to manage and share information
simply, and without loss of accuracy. “DWF
is without a doubt the best tool for our needs,”
said Dunn. “We create a lot of our designs with
AutoCAD, but converting them to DWF allows
us to share them with a greater number of people
since DWF files are usually about 1/20 the size of
DWG files. Even with the reduced file size,
however, there’s no loss of fidelity with DWF—
when you zoom in on a straight line, it’s still just
a straight line. It doesn’t turn into a blurry,
undefined pixel.”
Moving forward, Agrium KNO has plans to add
even more DWFs to its company intranet.“We’ve
had great success with DWF so far,” said Dunn.
“And we expect to continue using this technology
to our advantage, to make our operations as
efficient as they can be.”
For More Information
To learn more about how Autodesk can help
enhance collaboration though effective information
sharing visit www.autodesk.com/dwf.
To download the free DWF Viewer go to
www.autodesk.com/dwfviewer-download.
Wednesday, October 20, 2010
The Solution
Since 1992, the SCAS has used AutoCAD to help
it keep up with its facilities management needs.
From parking garages to meeting rooms to retail
lease plans, facilities drawings are managed and
maintained with AutoCAD by SCAS’ staff of two
design technicians. As new projects are initiated,
all existing infrastructure details are provided to
outside consultants with AutoCAD. When outside
consultants create new designs, SCAS’ staff uses
AutoCAD to integrate it with other facilities
information.
“From planning to operation, AutoCAD is our core
design application,” explains Wilson. “We use it
for everything, including new projects, historical
drawings, and planning routine maintenance.
We even use it to create precise ‘You Are Here’
signs to help passengers fi nd their way around
concourses. Additionally, because it’s so widely
used, AutoCAD allows us to work seamlessly with
outside consultants.”
Automated Calculations Save Time
Each year, SCAS must create property plans that
highlight the details of every retail and airline
tenant lease agreement. The plans are then
customized for use by the airport’s property
management, maintenance, and security staff.
Once created, the plans are bundled into sheet
sets for easy reference and printing. Until recently,
the process took an entire month to complete,
but new features included in AutoCAD 2006 have
signifi cantly accelerated the process.
According to Wilson, “With the recent release of
AutoCAD, we can customize the way we format
the display of area calculations by selecting the
appropriate unit of measurement when using fi elds
within a text object or table. That aspect of the
process was far more manual before. Because it
was manual, it was more error-prone. If something
didn’t add up, we had to check our calculations for
hundreds of rooms.”
The Sheet Set Manager, fi rst introduced in
AutoCAD 2005, has also improved the way SCAS
manages and shares sheet sets of leased property.
Wilson says, “Before, our designers had to fi nd and
print property plans when staff without AutoCAD
expertise needed them. Now we can quickly create
pre-defi ned DWF (Design Web Format) sheet sets
so that staff can fi nd and print the information,
allowing us to focus on design rather than
document retrieval.
Continuous Improvements
New releases of AutoCAD have proved so
advantageous to SCAS that it participates in
the Autodesk Subscription program. With its
subscription, SCAS automatically receives the
latest versions of shipping software. Autodesk
Subscription customers are also entitled to any
incremental product enhancements, personalized
web support direct from Autodesk technical
experts, and self-paced online training.
SCAS also participates in the Autodesk Beta
and Feedback Program, which gives SCAS the
opportunity to try new features in a testing
environment, a benefi t that resulted in a huge cost
savings in 2005.
“We were exploring some new measurement
functionality in AutoCAD by recalculating a landuse
mitigation fee,” explains Wilson. “It turns out
the agency that calculated the acreage in question
did so manually and incorrectly. By using AutoCAD
to spot the error, we were able to get the fee
reduced by $1.2 million.”
The Result
SCAS Completes Tenant Leases
25 Percent Faster
Having used AutoCAD for so many years, SCAS
anticipates that the application will continue to
evolve. “In the last year, AutoCAD has helped us
to complete our tenant lease plan processes 25
percent faster, which saved us an entire week,”
says Wilson. “We often suggest improvements
to Autodesk, and they respond. We are already
looking forward to the next release of AutoCAD
and how much more time it may save us.”
For More Information
To learn more, visit:
www.autodesk.com/autocad
Try AutoCAD at:
www.autodesk.com/autocad-trial
Provide feedback and input on the future of
AutoCAD:
http://myfeedback.autodesk.com.
“From planning to operation, AutoCAD is
our core design application. We use it for
everything, including new projects, historical
drawings, and planning routine maintenance.
We even use it to create precise ‘You Are
Here’ signs to help passengers fi nd their way
around concourses.”
Donald Wilson,
Principal Engineering Technician,
The Sacramento County Airport System
Monday, October 18, 2010
The Challenge Maintaining a Reputation of Excellence
Since its founding in 1983, Northern California
based structural engineering firm MKM &
Associates has built an impressive reputation for
dedication and expertise. The firm’s team of
engineers and structural technicians has been
entrusted with a wide range of commercial,
residential, and institutional projects throughout
the West Coast.
“At any given time, we might be designing a new
elementary school, planning the expansion of an
inn, engineering a large housing subdivision, or
working on a post tension slab for a four story
senior-assisted care facility,” said Mark Douglas, a
Structural Technician at MKM. “We’re always
working on multiple projects—we have at least
fifty projects in development right now.”
For MKM, continued success requires not just the
right people, but the right tools. “A key ingredient
in MKM’s continuing success has been its
commitment to incorporating state-of-the-art
technology,” explained Douglas. “Our challenge is
to stay abreast of the latest technological
innovations and make sure our people don’t get
pigeon-holed into an old way of doing things.”
The Solution
A Powerful New Release of AutoCAD
It was precisely this professional philosophy that
made upgrading to AutoCAD 2006—the world’s
leading software for 2D drafting, detailing, design
documentation, and basic 3D design—a natural
decision for MKM.
Additionally, the migration to AutoCAD 2006 was
virtually effortless. “Autodesk has done a great job
of making it painless to upgrade from version to
version,” said Douglas. “The built-in migration
tools really simplify the procedure. The whole
process was seamless—just a couple of clicks and
we were ready to start using the new software.”
The Results
Productivity Enhancing Innovations
AutoCAD 2006 provides a host of usability
improvements to everyday drafting and
documentation tools. One of the innovations that
has benefited MKM most has been the Dynamic
Blocks feature. Dynamic Blocks enable users to
reduce the size of their block libraries while giving
them block options that are easier to access,
manipulate, and place.
“The Dynamic Blocks have been great,” stated
Douglas. “In the past, it could be quite a chore to
create a block for every single type of steel shape,
for example, that you’d be working with. Because
the Dynamic Blocks automatically adjust as you’re
working with them, we’ve easily cut down the
amount of time we have to spend manipulating
blocks. Subsequent modifications to details and
plans have cut this block manipulation time
significantly. The way Autodesk has helped us to
automate the process is really quite impressiveyou’d
almost have to go out of your way to make a
mistake.”
Additionally, MKM has gained a productivity boost
by converting its long-standing library of LISP
applications into Dynamic Blocks. “It’s really
advantageous for our users not to have to
remember a series of different LISP routines in
order to run their production drawings,” said
Douglas. “When we were working on our post
tension slab project, we had six or seven
procedures that people had to memorize—now all
we have to remember is the Dynamic Block, or
drag it from a tool pallet, and it’ll accomplish the
same results for us.”
MKM also has seen significant time savings from
the powerful sheet set management features, first
introduced in AutoCAD 2005. “With the Sheet Set
Manager, we can literally hit three clicks and print
a thousand sheets—all collated and with updated
title block information,” said Douglas. “Previously,
that would have taken us two to three hours. If
anything’s the biggest timesaver in our office, it’s
probably that feature alone.”
A Foundation for Success
Overall, AutoCAD 2006 has provided MKM with
the state-of-the-art technology it needs to stay on
the cutting edge. “Upgrading to AutoCAD 2006 is
a win-win for everyone involved,” said Douglas. “It
makes sure our people are continually learning and
are finding new ways to be productive—and that,
in turn, allows us to offer the best possible service
to our clients. It’s just smart business.”
To learn more, visit:
www.autodesk.com/autocad
Sunday, October 10, 2010
So you want to know about the technical drawing stuff?
Now, it would be quite difficult to go into technical drawing and technical writings and keep things generalised.
Also I'd probably bore you too tears with if's and maybe's. So what I will do for you is go through the workings of a system that I have designed, built and commissioned into operation.
Ok yes it was a while ago but the theory of the design holds good, so also do the extra bits the customer wanted as their personal specification. I will put technical drawing snippets into this page in the very near future, so my appologies if the drawings are not there yet.
Also I have confirmed it's still in correct operation as of July '06 as I had some feed back about it via an engineer at the factory site. Nothing like a technical drawing revision just an interesting observation, but I asked how it was going, like you do. The reply was all well and good, I was pleased.
Before we launch headlong into the technical drawing stuff, let me put you in the picture as to what we’re looking at here.
I was charged with building a machine information system for seventeen machines in a box factory. I used small Mitsubishi PLC’s on each machine to gather individual machine data.
These PLC’s I called slaves because they were slave to the host system but they were, in fact, programmed as data loggers in their own right. These were all hard wired to the host computer using RS232 ports. Two 8-way RS232 cards were installed into the host computer for connecting all the machines to and I used one of the two existing RS232 ports on the computer. That gave me the seventeen ports needed.
It was the customers choice to use a single port for each machine (RS232 serial link can be daisy chained), so the whole system wouldn'd fail if a wire was broken/faulty. The technical drawing took me over two weeks as each machine had to have its own specific technical drawing of the connections into its control circuit.
The machines weren’t particularly high speed (nor were the operators, hee hee) so there were no technical barriers to break through. ports. Two 8-way RS232 cards were installed into the host computer for connecting all the machines to and I used one of the two existing RS232 ports on the computer. That gave me the seventeen ports needed.
It was the customers choice to use a single port for each machine (RS232 serial link can be daisy chained), so the whole system wouldn'd fail if a wire was broken/faulty. The technical drawing took me over two weeks as each machine had to have its own specific technical drawing of the connections into its control circuit.
The machines weren’t particularly high speed (nor were the operators, hee hee) so there were no technical barriers to break through. Mitsubishi PLC’s were used with RS232 modules and a button panel with an small array of indicators was made for each machine.
Button panels! Yes button panels were wanted to give some additional core data into the system. Things like the operator, job start time, job code and a data reset to clear all data before starting a new job. As you might guess the button panels weren’t too technical at all but served a valuable purpose.
The purpose of the system was to give the information about which job was on which machine, how long it had been running, when it was due to be completed, which operator was most efficient on a given machine and the more usual stuff like current speed, running or stopped, and machine efficiency.
Overview:
The HMI's panels were made to operate on the local PLC's updating/changing the data in the related PLC’s data memory’s. The local PLC's (seventeen of ‘em remember) were asked (polled) for their up to date information every minute.
This was sent via a RS232 line for each machine to the host computer for display. The host computer was dedicated to running the system, as they didn’t want any thing else to interfere with it. The main reason for this was that the host computer was also data logging line for each machine to the host computer for display. The host computer was dedicated to running the system, as they didn’t want any thing else to interfere with it. The main reason for this was that the host computer was also data logging all the total production figures on a daily basis as an operational history of their machines.
Right where were we, ah yes. Then the data once on the host computer was displayed in a text style within a formatted window. Also as mention above it was compiled in a spreadsheet file on the local hard drive and sent to a location on the server. These files was updated every minute when new data was received.
The file placed on the server was then called up with a remote display program if wanted or loaded into their spreadsheet program for further use within the current office system. The technical wrintings of data at this point was used for reports and stock control on a continuous basis.
The datalogger feature logging to the local hard drive kept the days total accumulated production figures for all the machines in a file with the date in the name. So the following day would automatically rename that days file with the new date so it would not overwrite the previous one.
In order to display the days and weeks past production figures within a spreadsheet program anthother part of the main program produced another file and kept adding each days figures to it. This file just had production data put into it so a picture of the past production could seen within a spreadsheet graph for the last month or quarter.
Well that’s about it in a nutshell,
so now into the technical drawing stuff of how it did all that . . . Yes?
Down to the nitty gritty then.
Starting back at the HMI buttton panels, these were not very technical at all, the indicator lights were being switched from the local slave plc. Which in turn was acting upon which button was being pressed or function performed. All 24V DC and a small piece of plc ladder program to steer which button did what and lit which panel light.
The panel lights were there purely to show the operator what was going on within the program at any given stage while pressing buttons. Well, with the exception of one, this one showed when RS232 data was being sent or received. The lights were all controlled from the slave PLC's outputs, more on that soon though.
The buttons themselves were wired directly to the inputs on the local slave PLC. Most of the signals used were tapped from existing machine signals so installation was quite straight forward. The client had and supplied me with copies of most of the machines technical drawings which made life quite easy.
Technical drawing showing tapped signals from existing machine control.
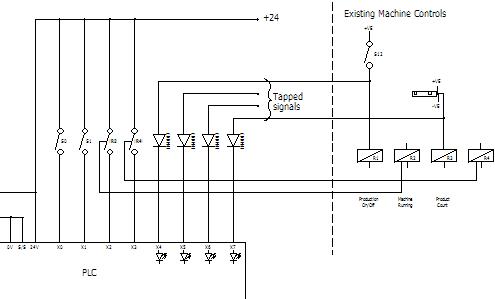 (See Electrical page for technical drawing write up)All the lights and buttons and the slave PLC were operating on the machines 24V DC supply. This addition drew very little current and this kept the system more tidy when installed on the machine(s) than giving it a separate supply, as well as that being unnecessary. There is always some spare capacity in a machines 24V DC control voltage supply, certainly for such a triffling amount of power.
Incidently, the only evidence that there was a system on each machine was of course the HMI panel and the small diameter RS232 cable going away from each machine. I'm currently looking for a suitable technical drawing of the HMI panel to place here to give you an idea of what the HMI panel looks like.
(technical drawing of the HMI panel will be here)
Right, onwards to the sensor signals used, first there was a running/stopped signal tapped off the machines main run contactor (a contactor is a high current capacity type of switching relay). Then a sensor looking at product going into the machine was tapped off, all but one of the machines had a sensor existing in this position, for its own counter. Handy for me to use of course.
At the opposite end of the machine there was a sensor counting the product out of the machine, again most of the machines already had this sensor in place, for those that didn't, a sensor (photocell, what some people call a magic eye) was installed. Quite straight forward to do as it was then dedicated to the machine information system slave PLC.
The technical drawing below shows how the sensors and tapped signals were wired to the slave PLC, this is a snippet of the actual customers technical drawing.
(MIS_Slave.gif to follow soon)
Just one more signal was use from the machines, that was a machine speed signal, all the machines had this signal available somewhere on each machine. This is different from the product signal as it's not dependant on production happening to give the signal.
Why machine speed as well as product count? The client was experimenting to try and find the most efficient speed for each machine to run at. Also with a view to streamlining the whole production process to reduce the production bottle neck effect.
This may seem like too few signals but that's what was wanted. However, from these signals it was then possible to display the following data on the host display screen.
- Machine running or stopped indicator.
- Good product.
- Waste product.
- Production efficiency.
- Average production speed per hour (p/h).
- Machine speed p/h.
- Machine efficiency.
- Down time.
- Date of last data reset.
This data was generated in the slave PLC counting pulses of product and machine operations etc. Once every 30 seconds the host PC would ask all the slave PLC's to send thier data, one after the other. This was then sent out via a RS232 module installed in the PLC, down a screened cable to the host PC.
Although normally the generation of other data, like efficiency, would be done in the host PC. Because of my fluent PLC programming skills, this was carried out in the slave PLC's to save the overhead on processing in the host display PC. This meant the data sent just have to be displayed or formatted and saved. The result was the system displays performed much quicker on the host PC.
How do I know? Because I tried it the other way first.
Which is a good thing because there is a marked improvement in the displays update speed when the host computer is not doing calculations first. Ok so it probably won't be noticable on the latest fast processor speeds, but why would you want to dedicate a latest fastest (expensive) PC to the job when one a year or two old (much cheaper) can do it perfectly, with some fore-thought applied.
My thinking was to use available resources in the PLC's first to make the system more efficient in it's operation, after all the host display PC may not be dedicated to the system in another application.
Mission accomplished in that area I believe.
Now we can leave the technical drawing stuff behind because the data is in the PC. From this point onwards what happens to the data is under the host display program control.
Have a look at the USB to RS232 Cable and the USB printer to parallel port converter cable reviews below, here as promised. These are the best ones I've found and I have personally tested them over time!
Also I'd probably bore you too tears with if's and maybe's. So what I will do for you is go through the workings of a system that I have designed, built and commissioned into operation.
Ok yes it was a while ago but the theory of the design holds good, so also do the extra bits the customer wanted as their personal specification. I will put technical drawing snippets into this page in the very near future, so my appologies if the drawings are not there yet.
Also I have confirmed it's still in correct operation as of July '06 as I had some feed back about it via an engineer at the factory site. Nothing like a technical drawing revision just an interesting observation, but I asked how it was going, like you do. The reply was all well and good, I was pleased.
Before we launch headlong into the technical drawing stuff, let me put you in the picture as to what we’re looking at here.
I was charged with building a machine information system for seventeen machines in a box factory. I used small Mitsubishi PLC’s on each machine to gather individual machine data.
These PLC’s I called slaves because they were slave to the host system but they were, in fact, programmed as data loggers in their own right. These were all hard wired to the host computer using RS232 ports. Two 8-way RS232 cards were installed into the host computer for connecting all the machines to and I used one of the two existing RS232 ports on the computer. That gave me the seventeen ports needed.
It was the customers choice to use a single port for each machine (RS232 serial link can be daisy chained), so the whole system wouldn'd fail if a wire was broken/faulty. The technical drawing took me over two weeks as each machine had to have its own specific technical drawing of the connections into its control circuit.
The machines weren’t particularly high speed (nor were the operators, hee hee) so there were no technical barriers to break through. ports. Two 8-way RS232 cards were installed into the host computer for connecting all the machines to and I used one of the two existing RS232 ports on the computer. That gave me the seventeen ports needed.
It was the customers choice to use a single port for each machine (RS232 serial link can be daisy chained), so the whole system wouldn'd fail if a wire was broken/faulty. The technical drawing took me over two weeks as each machine had to have its own specific technical drawing of the connections into its control circuit.
The machines weren’t particularly high speed (nor were the operators, hee hee) so there were no technical barriers to break through. Mitsubishi PLC’s were used with RS232 modules and a button panel with an small array of indicators was made for each machine.
Button panels! Yes button panels were wanted to give some additional core data into the system. Things like the operator, job start time, job code and a data reset to clear all data before starting a new job. As you might guess the button panels weren’t too technical at all but served a valuable purpose.
The purpose of the system was to give the information about which job was on which machine, how long it had been running, when it was due to be completed, which operator was most efficient on a given machine and the more usual stuff like current speed, running or stopped, and machine efficiency.
Overview:
The HMI's panels were made to operate on the local PLC's updating/changing the data in the related PLC’s data memory’s. The local PLC's (seventeen of ‘em remember) were asked (polled) for their up to date information every minute.
This was sent via a RS232 line for each machine to the host computer for display. The host computer was dedicated to running the system, as they didn’t want any thing else to interfere with it. The main reason for this was that the host computer was also data logging line for each machine to the host computer for display. The host computer was dedicated to running the system, as they didn’t want any thing else to interfere with it. The main reason for this was that the host computer was also data logging all the total production figures on a daily basis as an operational history of their machines.
Right where were we, ah yes. Then the data once on the host computer was displayed in a text style within a formatted window. Also as mention above it was compiled in a spreadsheet file on the local hard drive and sent to a location on the server. These files was updated every minute when new data was received.
The file placed on the server was then called up with a remote display program if wanted or loaded into their spreadsheet program for further use within the current office system. The technical wrintings of data at this point was used for reports and stock control on a continuous basis.
The datalogger feature logging to the local hard drive kept the days total accumulated production figures for all the machines in a file with the date in the name. So the following day would automatically rename that days file with the new date so it would not overwrite the previous one.
In order to display the days and weeks past production figures within a spreadsheet program anthother part of the main program produced another file and kept adding each days figures to it. This file just had production data put into it so a picture of the past production could seen within a spreadsheet graph for the last month or quarter.
Well that’s about it in a nutshell,
so now into the technical drawing stuff of how it did all that . . . Yes?
Down to the nitty gritty then.
Starting back at the HMI buttton panels, these were not very technical at all, the indicator lights were being switched from the local slave plc. Which in turn was acting upon which button was being pressed or function performed. All 24V DC and a small piece of plc ladder program to steer which button did what and lit which panel light.
The panel lights were there purely to show the operator what was going on within the program at any given stage while pressing buttons. Well, with the exception of one, this one showed when RS232 data was being sent or received. The lights were all controlled from the slave PLC's outputs, more on that soon though.
The buttons themselves were wired directly to the inputs on the local slave PLC. Most of the signals used were tapped from existing machine signals so installation was quite straight forward. The client had and supplied me with copies of most of the machines technical drawings which made life quite easy.
Technical drawing showing tapped signals from existing machine control.
Incidently, the only evidence that there was a system on each machine was of course the HMI panel and the small diameter RS232 cable going away from each machine. I'm currently looking for a suitable technical drawing of the HMI panel to place here to give you an idea of what the HMI panel looks like.
(technical drawing of the HMI panel will be here)
Right, onwards to the sensor signals used, first there was a running/stopped signal tapped off the machines main run contactor (a contactor is a high current capacity type of switching relay). Then a sensor looking at product going into the machine was tapped off, all but one of the machines had a sensor existing in this position, for its own counter. Handy for me to use of course.
At the opposite end of the machine there was a sensor counting the product out of the machine, again most of the machines already had this sensor in place, for those that didn't, a sensor (photocell, what some people call a magic eye) was installed. Quite straight forward to do as it was then dedicated to the machine information system slave PLC.
The technical drawing below shows how the sensors and tapped signals were wired to the slave PLC, this is a snippet of the actual customers technical drawing.
(MIS_Slave.gif to follow soon)
Just one more signal was use from the machines, that was a machine speed signal, all the machines had this signal available somewhere on each machine. This is different from the product signal as it's not dependant on production happening to give the signal.
Why machine speed as well as product count? The client was experimenting to try and find the most efficient speed for each machine to run at. Also with a view to streamlining the whole production process to reduce the production bottle neck effect.
This may seem like too few signals but that's what was wanted. However, from these signals it was then possible to display the following data on the host display screen.
- Machine running or stopped indicator.
- Good product.
- Waste product.
- Production efficiency.
- Average production speed per hour (p/h).
- Machine speed p/h.
- Machine efficiency.
- Down time.
- Date of last data reset.
This data was generated in the slave PLC counting pulses of product and machine operations etc. Once every 30 seconds the host PC would ask all the slave PLC's to send thier data, one after the other. This was then sent out via a RS232 module installed in the PLC, down a screened cable to the host PC.
Although normally the generation of other data, like efficiency, would be done in the host PC. Because of my fluent PLC programming skills, this was carried out in the slave PLC's to save the overhead on processing in the host display PC. This meant the data sent just have to be displayed or formatted and saved. The result was the system displays performed much quicker on the host PC.
How do I know? Because I tried it the other way first.
Which is a good thing because there is a marked improvement in the displays update speed when the host computer is not doing calculations first. Ok so it probably won't be noticable on the latest fast processor speeds, but why would you want to dedicate a latest fastest (expensive) PC to the job when one a year or two old (much cheaper) can do it perfectly, with some fore-thought applied.
My thinking was to use available resources in the PLC's first to make the system more efficient in it's operation, after all the host display PC may not be dedicated to the system in another application.
Mission accomplished in that area I believe.
Now we can leave the technical drawing stuff behind because the data is in the PC. From this point onwards what happens to the data is under the host display program control.
Have a look at the USB to RS232 Cable and the USB printer to parallel port converter cable reviews below, here as promised. These are the best ones I've found and I have personally tested them over time!
IO Gear GUC232A USB to RS232 Cable Review.
Sabrent USB printer to parallel port converter cable review.
Another USB to RS232 converter cable review coming soon.
With cool ice blue data light!
Link to Host Display Program writeup to follow soon.
Go to Custom Machine Builder page.
Have a little look-see at Electrical connection examples.
Return from Technical page to Home.
Note:
Some of the technical drawing snippets on this page may feature elsewhere on this site with a more detailed technical translation.
Tuesday, October 5, 2010
Computer-aided technologies
From Wikipedia, the free encyclopedia


Advanced CAx tools merge many different aspects of the product lifecycle management (PLM), including design, analysis using finite element analysis (FEA), manufacturing, production planning, product testing using virtual lab models and visualization, product documentation, product support, etc. CAx encompasses a broad range of tools, both those commercially available and those which are proprietary to the engineering firm.
The term CAD/CAM (computer-aided design and computer-aided manufacturing) is also often used in the context of a software tool covering a number of engineering functions.
[edit] List of computer-aided technologies


- Computer-aided design (CAD)
- Computer-aided architectural design (CAAD)
- Computer-aided design and drafting (CADD)
- Computer-aided process planning (CAPP)
- Computer-aided quality assurance (CAQ)
- Computer-aided reporting (CAR)
- Computer-aided requirements capture (CAR)
- Computer-aided rule definition (CARD)
- Computer-aided rule execution (CARE)
- Computer-aided software engineering (CASE)
- Component information system (CIS)
- Computer-integrated manufacturing (CIM)
- computer numerical controlled (CNC)
- Computational fluid dynamics (CFD)
- Electronic design automation (EDA)
- Enterprise resource planning (ERP)
- Finite element analysis (FEA)
- Knowledge-based engineering (KBE)
- Manufacturing process management (MPM)
- Manufacturing process planning (MPP)
- Material requirements planning (MRP)
- Manufacturing resource planning (MRP II)
- Product data management (PDM)
- Product lifecycle management (PLM)
- computer-aided manufacture (CAM)
Use Free Drawing Software to Work Like the Pros Without the Cost!
Free drawing software created a spark inside of me like nothing else had before by allowing me to bring what I was drawing on paper into the computer where I could instantly share it with the whole world over the internet.
There are a number of different types of drawing software out there. I checked out what I thought was the best free drawing software for each of the following areas: drawing and painting, illustration, and 3D. You may have heard of some commercial software, so I have compared these free packages to those commercial ones so you should have some idea of what to expect.
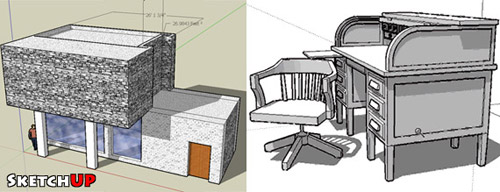 The fist software is called Sketchup and is brought to us for free by the kind people at Google. This free drawing software is a little different than the other packages. This one deals in the third dimension, or 3D. I first saw this program a few years ago, and it looks like Google has bought it and now released it for free - lucky us! I gave it a try and in about 10 minutes from installing the program I had created this little art-modern living space. I think this software is really cool - and if you are studying perspective, or are interested in architectural or technical drawings I would really highly recommend it. I'm having so much fun with this I think I may try designing a dream house for myself! If 3d and perspective sounds interesting to you go check it out at http://sketchup.google.com.
There are a number of different types of drawing software out there. I checked out what I thought was the best free drawing software for each of the following areas: drawing and painting, illustration, and 3D. You may have heard of some commercial software, so I have compared these free packages to those commercial ones so you should have some idea of what to expect.
Subscribe to:
Posts (Atom)